Most teams measure developer community success with surface-level metrics: Slack activity, new members, forum posts, event registrations.
Those numbers are not useless. They can show whether people are showing up. But they rarely tell you whether the community is actually changing anything.
If your developer community is meant to drive adoption, retention, contribution, advocacy, or product expansion, you need better signals.
We’re often asked:
- What metrics actually show developer community success?
- How do we track contribution quality, not just quantity?
- What’s the right way to measure retention or advocacy over time?
- How do these signals connect to product usage or revenue growth?
In this post, we break down the five types of signals we use with clients to measure developer community impact, especially the ones most teams miss.
If you’re wondering how to measure developer community success, prove DevRel ROI, or scale engagement without burning out your team, the answer is not tracking more activity. It is tracking the right behavior.
You’ll learn how to:
- Measure contribution quality in a developer-friendly way
- Track retention in terms of real value, not just activity
- Spot early signs of advocacy and product alignment
- Align internal teams on what “success” really means
At Stateshift, we help B2B tech companies connect community activity to business outcomes without reducing the work to a vanity-metric dashboard.
If your team is tracking members, posts, and event registrations but still cannot explain what changed, the measurement system is probably too shallow.
Developer community work should show whether people are moving closer to trust, adoption, contribution, retention, or advocacy. If the numbers only prove that people showed up, they are not telling you enough.
Here’s how to measure developer community success by spotting the difference between community theater and community impact, with the hidden signals that truly measure community health.
The Vanity Metrics Trap: Why Most Teams Get It Wrong
The Problem: 87% of community teams track engagement volume over engagement quality, according to recent research from CMX’s Community Industry Report. They celebrate 1,000 new Discord members while ignoring that only 12 are actually contributing anything useful.
The Reality: Developer communities aren’t social networks. They’re technical collaboration systems where quality trumps quantity every single time.
At Stateshift, this comes up in nearly every Discovery Call we have with developer-focused companies. Teams show us beautiful growth curves while their actual contributors are burning out, their best members are going quiet, and their community is slowly becoming an echo chamber.
What “Engagement” Actually Looks Like:
- Surface Level: Message count, member growth, event attendance
- Value Level: Knowledge creation, peer support, technical problem-solving
- Business Level: Product adoption acceleration, churn reduction, organic advocacy
The communities that drive real business outcomes focus relentlessly on the value and business levels, not the surface metrics that look impressive in quarterly reviews.
Quality Over Quantity: What Actually Indicates Community Health
Big numbers don’t mean big impact. True community success is about creating value and trust, not just activity. Simply counting sign-ups or Slack messages doesn’t reveal who’s truly invested in your product or mission.
Real community health shows up in thoughtful contributions, ongoing commitment, and authentic advocacy. It means developers are building tools, writing detailed guides, solving each other’s issues, and expanding the ecosystem on their own—not just reacting to prompts from your team.
The Community Health Indicators That Matter
Tier 1: Foundation Metrics (Track These First)
- Monthly Active Contributors (MACs): Users creating value, not just consuming content
- Peer-to-Peer Support Ratio: Community answers vs. team answers in support channels (target: 3:1 or higher)
- Knowledge Creation Rate: User-generated tutorials, guides, solutions, and best practices
- Contributor Retention: 90-day and 180-day return rates for active contributors
Tier 2: Quality Indicators (Track Quarterly)
- Solution Acceptance Rate: Percentage of community answers marked as helpful or solved
- Advanced Discussion Quality: Technical depth and sophistication of community conversations
- Cross-Platform Engagement: Users active across multiple community channels
- Community-Driven Innovation: User-created tools, integrations, or extensions
Humans look for reliable, high-quality signals. Stripe’s ecosystem thrives because of developer-built tools that meaningfully extend its APIs, creating true functional value and solving real-world problems.
These contributions deepen product value, foster developer pride, and build long-term loyalty. They transform a passive audience into active builders and make your community indispensable rather than optional.
Retention Over Growth: The Foundation Metric Most Teams Ignore
Growth is exciting, but retention is what builds a foundation. It’s easy to get caught up in vanity metrics and think that a surge in new sign-ups means you’re winning. But without strong retention, that growth is a mirage—new people in, old people out.
A community that keeps contributors engaged builds real trust and momentum. GitLab publishes contributor retention data to highlight community stability and transparency—a move that signals strength to developers, partners, and investors alike.
High retention rates mean that your community members see real value and are motivated to keep showing up and contributing.
How to Track Community Retention That Matters
The 90-Day Active Contributor Test:This is the metric we focus on in our Blueprint Calls because it cuts through the noise. Track users who make meaningful contributions (not just comments or reactions) and measure how many return to contribute again within 90 days.
Implementation Framework:
Step 1: Define “Active Contributor” Clearly – An active contributor could be someone who submits code, engages consistently in technical discussions, attends events, or creates valuable educational content. Set criteria that are clear, measurable, and aligned with your business goals.
Step 2: Set Up Simple Tracking Systems – Use a dashboard or analytics tool (Common Room, GitHub Insights for open source projects, or even a well-structured spreadsheet) to automatically capture contributor activity. Clearly mark entry points (first contribution or attendance) to accurately measure the 90-day and 180-day intervals.
Step 3: Analyze Returning Contributors Monthly – Review contributor retention rates at 90-day and 180-day milestones. Look for patterns or commonalities among contributors who stay active. Are they engaging through events, forums, code commits, or mentorship activities?
Step 4: Act on the Insights – Identify trends such as successful events, mentorship programs, or discussion topics that correlate with higher retention. Directly address common issues revealed in surveys (onboarding confusion, lack of recognition, unclear pathways for contribution).
Benchmark Expectations:
- Healthy Communities: 25-40% of first-time contributors return within 90 days
- Thriving Communities: 15-25% of contributors remain active after 180 days
- Elite Communities: 10-15% become long-term champions (12+ months active)
Through our work with 240+ tech companies, we consistently see that focusing on retention over growth leads to stronger business outcomes and more sustainable community programs.
Measuring Contribution Quality: Beyond Pull Request Counting
Counting every pull request as a win is like celebrating every bug fix as a new feature. It might feel good in a weekly update, but it does little for real product growth.
High-quality contributions improve products, reduce technical debt, and build credibility among both developers and customers.
DigitalOcean attributes its thriving developer ecosystem to community-created tutorials, guides, and resources that dramatically simplify complex cloud infrastructure tasks. These community-driven resources don’t just offer quick solutions; they actively empower developers to explore new use cases, broaden their technical skills, and advocate organically within the developer community.
The Contribution Quality Framework
High-Impact Contributions (Weight These Heavily):
- Merged pull requests that add core features or meaningful functionality
- Documentation improvements that measurably reduce support tickets
- Educational content (tutorials, guides) that other community members reference and build upon
- Integrations or tools that open up entirely new use cases or market segments
Medium-Impact Contributions (Track for Volume):
- Bug fixes and small feature improvements
- Community support responses that help other members
- Event participation and technical presentations
- Code reviews and collaboration on others’ contributions
Low-Impact Contributions (Don’t Ignore, But Don’t Overweight):
- Simple typo fixes and formatting improvements
- Basic questions or requests for help
- Social interactions without technical substance
Implementation: Quality-Weighted Contribution Scoring
Create a scoring system that weights contributions by impact:
Business Impact Score:
- Does this contribution reduce customer support load?
- Does it enable new use cases or integrations?
- Does it improve product adoption or user success?
- Does it generate follow-up engagement or discussion?
Technical Quality Score:
- Is the contribution technically sound and well-implemented?
- Does it follow community standards and best practices?
- Is it documented and easy for others to understand?
- Does it spark technical discussions or knowledge sharing?
Analyze which types of contributions lead to measurable usage increases, feature adoption improvements, or churn reduction to prove their true value to your business.
Event Engagement That Actually Drives Outcomes
A packed RSVP list means nothing if your audience is scrolling TikTok during your talk. Even worse, it can give a false sense of success that stalls real improvement.
Events are your chance to check the community’s emotional pulse and build momentum in real time. CMX’s 2023 Community Trends report showed that communities measuring engagement—not just attendance—see up to 30% higher post-event contributions and stronger retention over time.
This is because active participation sparks relationships, learning moments, and shared ownership that static content simply can’t achieve.
Event Engagement Metrics That Matter
During-Event Engagement:
- Live participation metrics: Questions asked, upvotes, poll responses, breakout activity
- Technical depth: Complexity and sophistication of questions and discussions
- Cross-participant interaction: Community members helping and building on each other’s ideas
- Real-time problem solving: Live debugging, code sharing, or collaborative technical work
Post-Event Impact:
- Follow-up contributions: GitHub commits, documentation updates, or forum discussions sparked by the event
- Implementation evidence: Screenshots, demos, or examples of attendees applying what they learned
- Community relationship building: New connections and ongoing collaborations formed
- Knowledge propagation: Attendees sharing insights with their teams or broader community
Event Optimization Based on Engagement Data
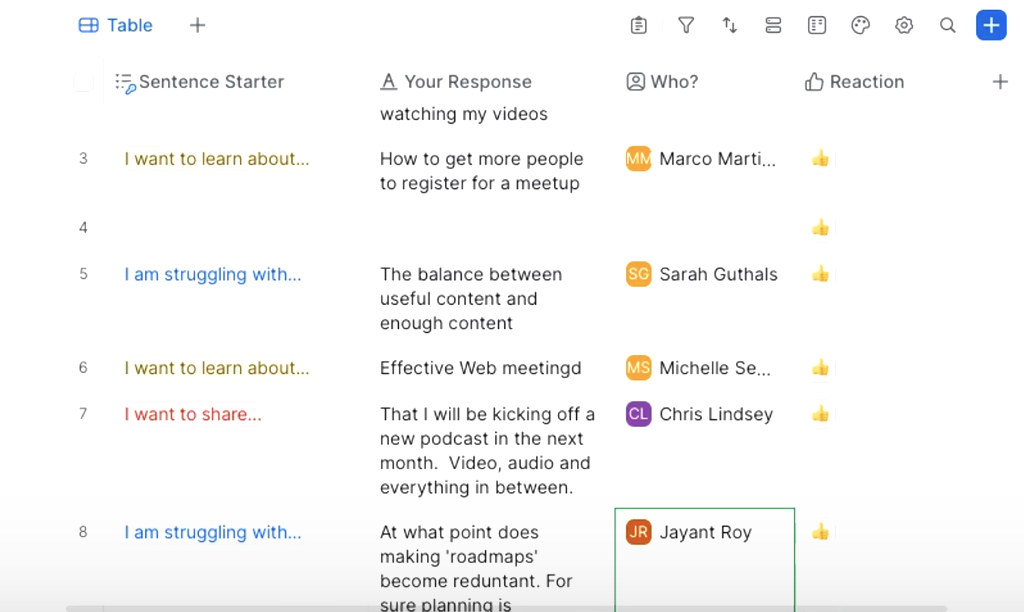
At Stateshift, we use shared documents during live sessions to capture and upvote discussion topics in real-time. This turns passive listeners into active contributors and makes every event a launchpad for deeper community involvement.
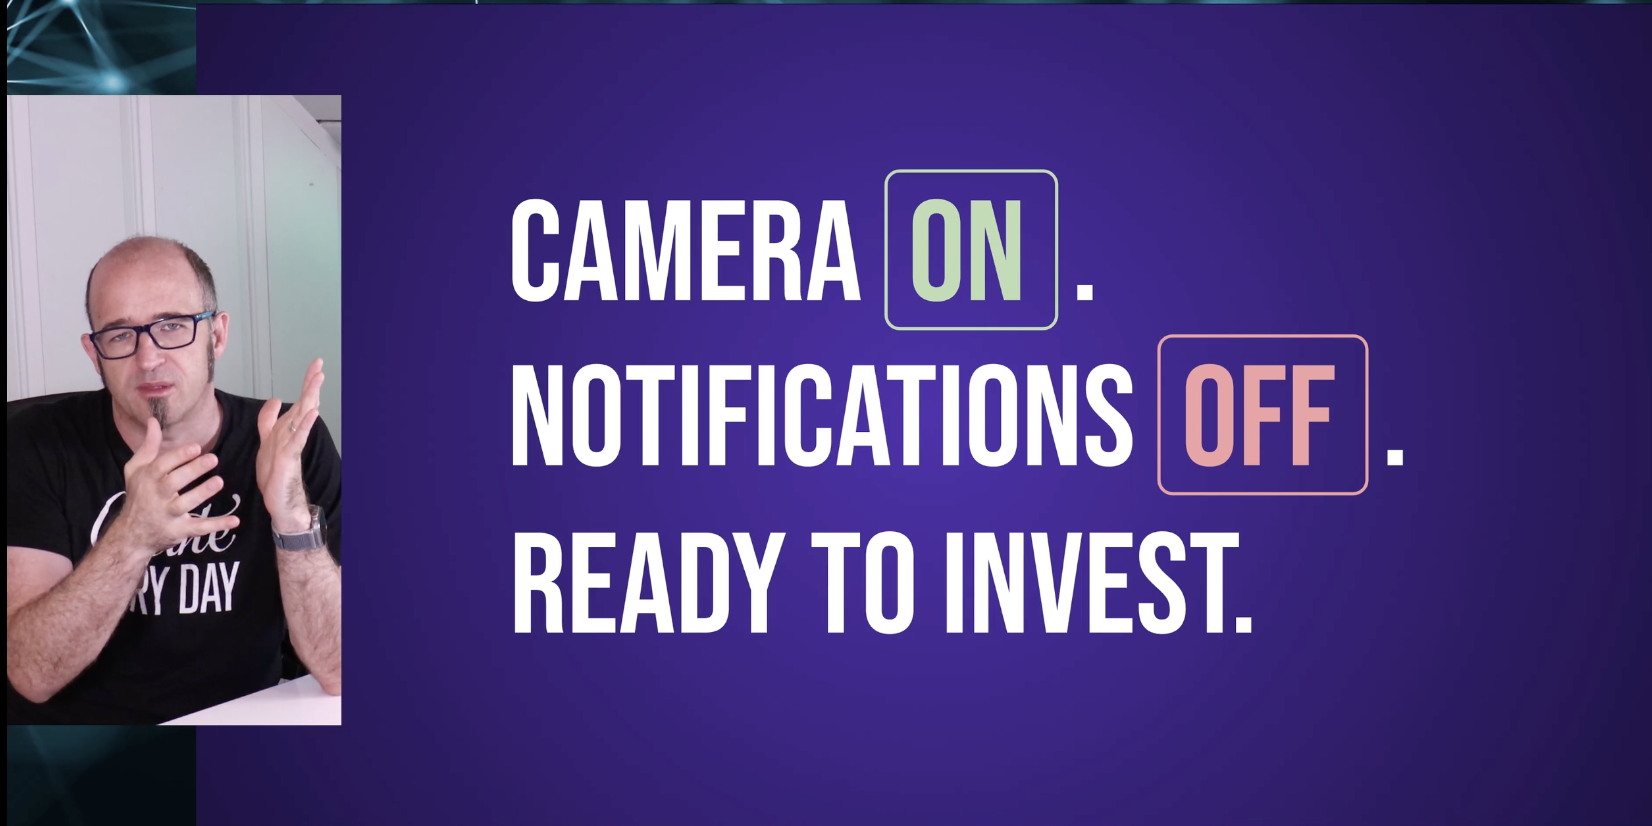
What Works:If you’ve ever joined a Stateshift session, you know we always start with, “Camera on. Notifications off. Ready to invest.” This sets the tone immediately—you’re there to participate, not just sit back and watch. That expectation creates higher engagement and stronger connections.
Engagement Optimization Tactics:
- Pre-event setup: Send technical prerequisites and context so participants come prepared to engage
- Interactive formats: Live coding, collaborative problem-solving, Q&A-driven discussions
- Follow-up systems: Capture contact info for engaged participants and invite them into ongoing discussions
- Content creation: Turn high-engagement moments into tutorials, case studies, or community resources
Mozilla tracks detailed post-event feedback to shape future sessions, and according to recent CMX research, communities that analyze event engagement more deeply can see up to 30% higher follow-up contribution rates.
Spotting Unprompted Advocacy: The Ultimate Community Health Signal
The most valuable promotion is the organic kind that happens without you even asking.
Datadog attributes major adoption gains to community-built integrations they never commissioned. When developers create blog posts, videos, or integrations on their own, they demonstrate deep trust and commitment.
This kind of organic advocacy often reaches new audiences, builds credibility faster than any paid campaign, and can become a core part of your growth engine. It signals that developers see so much value they are willing to stake their own reputations on recommending you.
How to Track and Measure Organic Advocacy
Advocacy Signal Detection:Track organic mentions through developer-focused channels where your audience actually hangs out:
- Stack Overflow: Monitor questions and answers mentioning your product
- Reddit: Track relevant subreddits (r/programming, r/webdev, language-specific communities)
- GitHub: Monitor stars, forks, and issue discussions on your repositories
- Developer blogs and newsletters: Set up Google Alerts for technical content mentions
- Conference talks and podcasts: Track speaking mentions and technical discussions
Watch for unexpected champions and consider spotlighting or supporting them further to amplify authentic voices and build deeper trust.
Advocacy Quality Assessment:
- Technical credibility: Are advocates respected in their technical communities?
- Audience relevance: Do their followers match your ideal customer profile?
- Content depth: Are they creating substantial, helpful content about your product?
- Consistency: Is advocacy part of ongoing engagement or a one-time mention?
Advocacy Amplification Strategy:When you identify genuine advocates:
- Invite them to beta programs or exclusive events
- Feature their content in official channels (with permission)
- Provide them with early access to new features or resources
- Connect them with your product team for feedback and influence
Advocacy ROI Measurement
Track the business impact of organic advocacy:
- Attributed signups: New users who mention discovering you through advocate content
- Conversion rates: Higher trial-to-paid conversion from advocacy-driven traffic
- Retention impact: Users acquired through advocacy often show higher long-term retention
- Expansion influence: Advocates often drive adoption within their organizations
The compound effect of authentic advocacy creates sustainable growth that’s much more cost-effective than paid acquisition.
Empowering Emerging Leaders: The Multiplier Effect
A community without leaders is just a group chat waiting to fizzle out. Strong leaders turn passive members into contributors, help set cultural norms, and act as trusted guides for new participants.
Microsoft’s MVP and Google’s Developer Expert programs highlight how empowering leaders builds a self-sustaining culture. These programs show that when you formally recognize and support leaders, they take ownership, inspire others, and keep the community vibrant even without constant intervention from your core team.
Gartner research shows that communities with strong volunteer leaders reduce core team workload by up to 40% and see faster product adoption rates.
Identifying and Developing Community Leaders
Leadership Signal Detection:Look for community members who:
- Naturally mentor others: Answer questions thoughtfully and help newcomers succeed
- Drive technical discussions: Initiate conversations about advanced topics or best practices
- Bridge connections: Introduce community members to each other and facilitate collaborations
- Show consistent engagement: Regular participation over extended periods (6+ months)
Leadership Development Framework:Once you identify potential leaders:
- Recognition: Publicly acknowledge their contributions and expertise
- Responsibility: Offer meaningful roles like event hosting, content review, or newcomer onboarding
- Resources: Provide access to advanced features, early releases, or exclusive information
- Autonomy: Give them authority to make decisions and shape community direction
Leader Impact Measurement
Community Health Metrics Influenced by Leaders:
- Response time improvement: Average time for community questions to receive helpful answers
- Member retention: New members who engage with leaders show higher long-term retention
- Knowledge quality: Overall technical depth and accuracy of community discussions
- Cultural strength: Consistent adherence to community values and behavior standards
Business Impact from Community Leadership:
- Support cost reduction: Leaders handling questions that would otherwise require staff time
- Feature adoption acceleration: Leaders championing new features and helping others implement them
- Expansion revenue: Leaders often influence purchasing decisions within their organizations
- Talent pipeline: Strong community leaders frequently become employees or contractors
Through our Acceleration Flywheel process, we help companies identify leadership potential early and create systematic development programs that scale community impact.
Product Adoption: The Ultimate Community Success Metric
A community that doesn’t drive product adoption is just a social club.
Twilio links community contributions directly to new customer growth and market expansion. By connecting community activity with feature adoption and upsell rates, they turn engagement into measurable revenue growth.
This approach transforms community work from a “nice to have” into a measurable growth engine that directly supports business goals. It helps teams justify community investment at the executive level and strengthens alignment between community, product, and revenue teams.
Community-Driven Adoption Measurement
Product Usage Correlation:Track how community engagement correlates with:
- Feature discovery and adoption speed: Community members adopt new features 25-40% faster
- Product depth utilization: Engaged community members use more advanced features
- Integration success rates: Higher success rates for complex implementations among community participants
- Time to value: Faster onboarding and initial success for community-engaged users
Revenue Impact Assessment:
- Customer Lifetime Value (LTV): Community-engaged customers typically show 15-30% higher LTV
- Net Dollar Retention: Community participants expand usage and spend at higher rates
- Churn prevention: Significantly lower churn rates among active community members
- Organic growth: Community-driven referrals and word-of-mouth expansion
Implementation Framework: Community-to-Revenue Attribution
Phase 1: Data Integration (Month 1)Connect community engagement data with product usage and customer success systems. Tag customer accounts with community engagement levels and track community touchpoints throughout the customer journey.
Phase 2: Cohort Analysis (Month 2-3)Create user cohorts based on community engagement levels:
- High Engagement: Regular community participation, content creation, event attendance
- Medium Engagement: Occasional community interaction, content consumption
- Low Engagement: Minimal community touchpoints, product-focused interaction
- No Engagement: No recorded community interaction
Phase 3: Business Impact Analysis (Month 3-4)Compare key business metrics across engagement cohorts:
- Customer acquisition cost and conversion rates by engagement level
- Time-to-value and onboarding success rates
- Feature adoption velocity and product utilization depth
- Retention, expansion, and advocacy rates
Advanced Community Metrics: Beyond the Basics
Community Sentiment and Health Trends
Qualitative Health Indicators:
- Discussion tone analysis: Are conversations becoming more positive or negative over time?
- Technical confidence: Are community members attempting more complex implementations?
- Peer relationship strength: Evidence of ongoing collaborations and knowledge sharing
- Innovation indicators: Original ideas, creative implementations, and novel use cases emerging
Community Ecosystem Maturity:
- Self-governance emergence: Community members helping enforce standards and resolve conflicts
- Knowledge base development: Organic creation of wikis, FAQs, and reference materials
- Mentorship networks: Experienced members actively helping newcomers
- Event and content initiative: Community-driven meetups, tutorials, and educational resources
Competitive Community Analysis
Market Position Assessment:
- Community growth rates: How does your community growth compare to competitors?
- Engagement quality comparison: Depth and technical sophistication of discussions
- Innovation velocity: Rate of new tools, integrations, and use cases being developed
- Mind share indicators: Conference mentions, technical blog citations, job posting requirements
Community Migration Patterns:
- Developer switching signals: Community discussions about moving to or from competing platforms
- Feature gap identification: Requested capabilities that competitors haven’t addressed
- Integration preferences: Tools and platforms your community prefers over alternatives
Understanding these patterns helps predict market shifts and identify strategic opportunities for community investment.
Tools and Implementation: Building Your Community Measurement System
Essential Community Analytics Stack
Community Measurement Platforms:
- Common Room: Comprehensive developer community analytics ($500-1500/month)
- GitHub Insights: Native analytics for open source communities (free with repositories)
- Platform-Specific Analytics: Discord Server Insights, Slack Analytics (often free with platform)
- Product Analytics Integration: Amplitude, Mixpanel to correlate community engagement with product usage
Advocacy and Mention Monitoring:
- Google Alerts: Set up alerts for your product name + technical keywords (free)
- Reddit monitoring: Manual tracking or custom scripts for relevant subreddits
- Stack Overflow tracking: Monitor questions and answers mentioning your product
- Social media monitoring: Twitter/X searches, LinkedIn technical discussions
Data Integration and Analysis:
- Customer Data Platform: Segment, RudderStack for unified community and product data
- Business Intelligence: Connect community metrics with CRM and revenue data
- Survey and Feedback Tools: Typeform, Google Forms for qualitative community health assessment
Total Monthly Budget: $500-2,000/month for comprehensive community measurement (many essential tools are free)
Implementation Roadmap: 60-Day Community Metrics Setup
Days 1-14: Foundation Setup
- Audit current community tracking and identify measurement gaps
- Define “active contributor” criteria and community health indicators
- Set up basic tracking in chosen community analytics platform
- Create baseline measurement dashboard
Days 15-30: Advanced Tracking Implementation
- Implement sentiment monitoring and advocacy detection
- Set up cohort analysis comparing community-engaged vs. non-engaged users
- Create automated reporting for key community health metrics
- Begin tracking community-to-product adoption correlation
Days 31-45: Business Integration
- Connect community data with CRM and customer success systems
- Implement community engagement scoring for customer accounts
- Create executive-ready reporting showing community business impact
Days 46-60: Optimization and Scaling
- Analyze initial data to identify highest-impact community activities
- Optimize community programs based on retention and quality metrics
- Create predictive models for identifying high-value community members
- Establish ongoing measurement and optimization processes
Frequently Asked Questions: Advanced Community Measurement
How do you measure developer community success?
Measure developer community success by tracking whether developers are moving toward product adoption, contribution, retention, advocacy, or trust. Activity metrics matter, but behavior change is the stronger signal.
What metrics prove DevRel or developer community ROI?
Define “active contributor” clearly (code contributions, technical discussions, educational content creation), then track how many return to contribute within 90 and 180 days. Use community analytics platforms to automate this tracking and segment contributors by engagement type and quality. Healthy communities see 25-40% return within 90 days.
When should a B2B tech company get outside help measuring developer community impact?
Bring in outside help when your team tracks community activity but cannot explain what changed. Stateshift helps B2B tech companies connect developer community, DevRel, and go-to-market strategy to measurable outcomes.
Key Takeaways: Community Metrics That Drive Real Growth
Essential Measurement Framework:
- Retention First: Track 90-day and 180-day contributor return rates as your north star metric
- Quality Over Quantity: Weight contributions by business impact and technical value, not volume
- Business Correlation: Connect community engagement directly to product adoption and revenue outcomes
- Advocacy Amplification: Monitor and support organic advocacy that extends your reach authentically
Implementation Priorities:
- Month 1: Establish baseline measurement for contributor retention and engagement quality
- Month 2-3: Implement community-to-product adoption tracking and cohort analysis
- Month 4-6: Optimize community programs based on retention data and business impact correlation
- Ongoing: Use measurement insights to guide community strategy and prove ROI to executives
Success Indicators:Communities that implement comprehensive measurement see 40% better budget retention, 35% higher program investment, and clear correlation between community health and business growth.
Most importantly when learning how to measure developer community success: Track what drives behavior change, not what makes pretty charts The strongest developer communities aren’t just active—they’re indispensable growth engines that create competitive advantages competitors can’t easily replicate.
Stop Measuring Theater, Start Measuring Impact
At Stateshift, we help companies move beyond vanity metrics and build developer ecosystems that actually drive product adoption and loyalty—not just “buzz.”
Our Discovery Calls help identify which community metrics actually matter for your specific product and audience. Our Blueprint sessions create measurement frameworks that connect community health directly to business outcomes executives care about.
If you’d rather show impact than slides, let’s talk. Stop defending community investment with activity reports and start proving community ROI with metrics that matter.
Related Resources:
- How to Prove DevRel ROI: Metrics That Actually Matter
- Stop Doing “Community Stuff” – Start Building Growth Engines
- The Best Way to Market to Developers