
Somewhere, a very smart group of people looked at a bag of chopped vegetables and decided it needed precision software. Somebody drew up the specs. Somebody else raised about $120 million, according to Wikipedia. The machine launched at $699. Then in April 2017, The Verge reported on a Bloomberg finding that you could squeeze the packs by hand and get nearly identical results. Sales were suspended that September.

Most people file Juicero under over-engineering. I think the machine worked fine. What collapsed was the belief that it was worth $699. And before you chuckle smugly into your oat latte, your DevTool roadmap is probably doing the same thing right now. You’re polishing function while developers decide in their first session whether you’re worth their time. Let’s fix that.
TL;DR
DevTool adoption comes down to two jobs your product has to do: work, and be believed. Most teams only fund the first. Docs, onboarding and messaging are where developers decide whether to believe you, so audit your roadmap through a perception lens, measure perceived value directly, and staff for it.
Two kinds of value, and why DevTool building needs both
Every product gets sold twice. Once on what it does, and once on what people believe about it. Most teams pour everything into the first sale and then act baffled when the second one falls through.
Functional value is what your product actually does: the features, the speed, the reliability, the API call that returns what it promised. It lives in the spec sheet, the benchmark and the changelog, and it’s the part your engineers can prove in a pull request. Perceived value is how good the product feels to use and how much people believe it’s worth. It’s how clear the first screen is, how fast the quickstart gets someone to a result, how the docs read, and whether your messaging sounds like a peer or a billboard. Two products can do exactly the same job and sit at wildly different prices in people’s heads. Juicero found that out the expensive way.
Most teams only pull the first lever, because it comes with a ticket, a sprint and a deeply satisfying graph. Nobody has ever been thrown a party for a vibe.
My hunch is that plenty of teams put something like 90% of their resources into function and 10% into perception, when 60/40 or even 50/50 would serve them better. Pick your own number. Just make sure it isn’t 90/10.
Developers make this harder, and I say that with love. They expect specificity over hype, which rules out the coat of paint. Perception has to come from things they can see, run and test. Slap a shiny landing page over a confusing quickstart and they’ll spot it faster than a cat spots an open can of tuna.
Why function alone hits a wall
Function has diminishing returns, and they arrive earlier than anyone wants to admit. Shaving a page load from two seconds to one is something users notice. Going from 0.5 seconds to 0.3 is something your team throws a party about and your users never register. Picture an entire engineering org throwing a parade for a 0.2 second improvement while the person it was built for is still hunting for the sign-up button.
Roadmap meetings are where perception goes to die. It turns up with a feeling, gets asked for a spreadsheet, and is politely told to circle back next quarter. So everyone goes home having optimized the wrong thing very efficiently, a bit like Michelangelo spending a decade perfecting the scaffolding.
Perception in the wild
Why does perception carry so much weight? Because nobody meets your product as it actually is. They meet it through what they can see, what they expected, and how the first few minutes felt. Function is real, but it stays invisible until someone gets far enough to use it, and perception decides whether they get that far. Two examples show it, with the shaky bits flagged as we go.
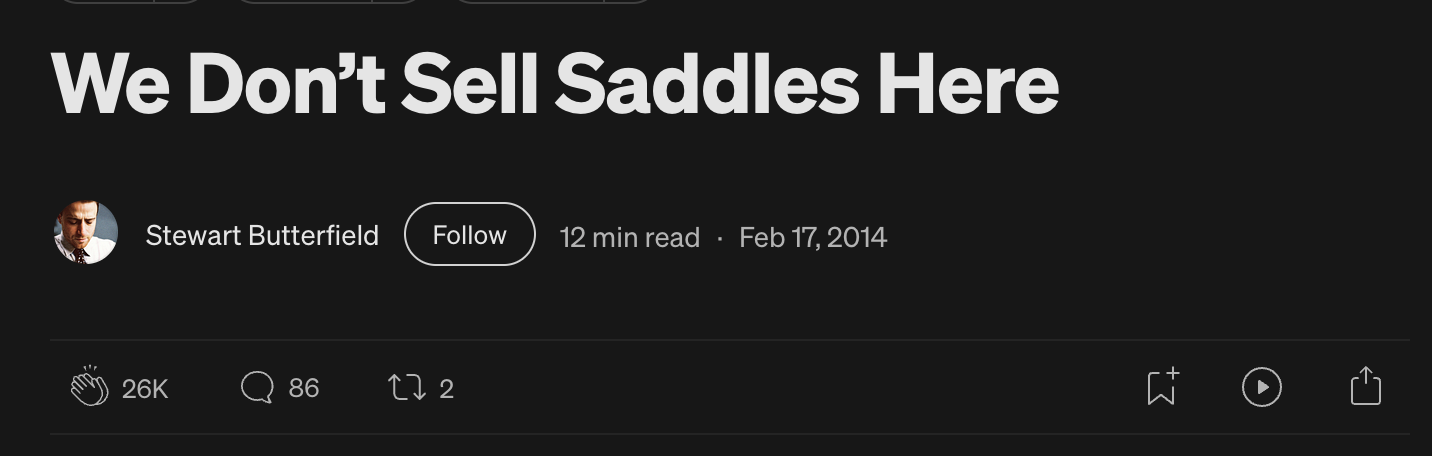
Slack is the classic. In 2013, Stewart Butterfield wrote a memo called “We Don’t Sell Saddles Here”, framing the product by its benefit rather than its features. Nobody wakes up wanting a chat tool. They wake up wanting their team to stop being a mess. According to First Round Review, teams that had exchanged 2,000 messages had tried Slack in earnest, and 93% of those teams were still using it. That’s a correlation, so don’t read it as the messages causing the staying. It does show how much the first stretch of use tells you about who sticks around.
Then there’s the Domino’s Pizza Tracker, which launched on January 30, 2008 and shows real order progress from the moment you place the order to the moment someone is knocking on your door. A tracker doesn’t cook a single pizza. It just tells you where your dinner is, and somehow the wait feels shorter.
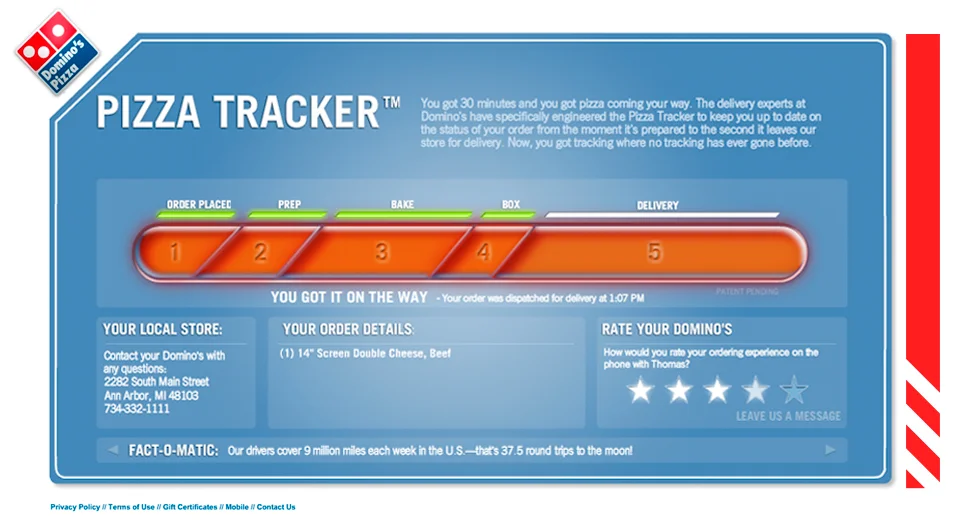
People judge a product by what they can see it doing for them. If your product does brilliant work invisibly, don’t be surprised when developers behave as though it did less. A magician who never lets the audience see the trick doesn’t get applause. He gets an empty room.
Where a DevTool’s perceived value gets built
Let’s talk about docs, because I have feelings. You find a promising tool. You click “Documentation.” The one page that exists describes version two of a thing that is now on version five, the code sample throws an error, and the search bar returns “no results” for the product’s own name. You’ve mentally moved on and are quietly evaluating a competitor. Postman’s 2023 State of the API Report found that 52% of respondents name lack of documentation as the biggest obstacle to consuming APIs. More than half the people trying to use APIs get stuck on the part where somebody was supposed to write down how it works. The manual is a rumor.
So yes, write the docs. Then hold them to a harsher test. “They read the docs” doesn’t count as an aha moment. A working API call that returns something useful does.
Postman found the same thing from the other direction. First successful API calls came 1.7x to 56x faster when a publisher provided a forked collection. Postman was measuring its own product, and it says the gain can’t be credited to documentation alone, so treat it as a hint. The pattern is still hard to miss: people want to get somewhere and don’t much care about reading the brochure. Teams happily polish how fast the docs load. Whether a developer reaches a result and wants to stay is harder to measure and probably worth far more, which is exactly why it keeps losing the roadmap fight.
For a developer, trust is a product feature. They form their opinion from the first thing that works or doesn’t. A developer’s first value moment is almost always technical: a real answer, a fix, or a docs page that fills a gap. Which makes your docs and quickstart your first impression, whether or not anyone in marketing ever signed off on them. Sorry, marketing.
Three tactics to try this week
You can’t fix perception by feel, so each of these gives you something to inspect, count or change before Friday.
1. Audit your roadmap through the perception lens
For every feature that improves function, ask whether the same perceived outcome could come from changing the presentation instead.
Our brand positioning guidance has a line I like: people don’t buy products, they join movements. When two features compete for roadmap space, the one that more directly supports a core belief should usually win. If you can’t say which belief a feature supports, congratulations, you’ve found your hobby project.
Messaging belongs in this audit. Developer messaging should be specific, admit trade-offs and frame things around tasks and problems. Words like “accelerate” and “revolutionize” reduce engagement, while “simply” and “just” erode trust. If your homepage sounds like a keynote slide, you already know what to fix. If it contains the phrase “supercharge your workflow”, please sit down, have a glass of water, and delete it.
The economic buyer signs the check, but the developer decides whether a tool survives.
2. Measure perceived value directly
Survey users about specific interactions. Ask how the first run felt, not whether they were satisfied. “How was your experience?” gets you a cheerful 4 out of 5 and zero information. You’ll often find that what your engineers are proudest of isn’t what users value most, which is a humbling afternoon for everyone involved, myself included.
Then count something. We use an Activation stage which follows a visitor through four gates: Interest (they land on your page), Intent (they click the main button), Implement (they sign up, install or create an API key) and Result (they get something useful out of it). Start with the first jump. Interest to Intent is the share of first-time landing page visitors who click the primary call to action, such as “create an API key”. Divide the clicks by the arrivals. If 100 people land and 10 click, you’re at 10%.
Here’s our rule of thumb. At 10% the page is broken. At 15% it’s better but still not enough. At 25% you have real momentum, and 30 to 40% is the target. These are our working benchmarks, so use them as a yardstick for your own page and not as a strict law.
If you’re under target, change one element at a time, starting with the headline and strapline, because visitors read those in the first two or three seconds. Re-measure after each change. Check your traffic too: if the wrong audience is arriving, a low rate says more about your positioning than your page. And track the button click as its own event, separate from completed signups, or the number will quietly lie to you.
Then measure what happens after the click. The aha moment should arrive within 10 minutes as something you can observe, like an API call that returns useful data. In our experience, at least 50% of developers who reach Implement should get to Result. From first website visit to Result, 20% or better is a reasonable starting benchmark.
For retention, track seven-day return rate and time to first value, then watch 30-day retention. We’ve also written about why developer products lose people between signup and second use, in our post on product stickiness.
3. Staff for perception
Count who on your team owns how the product feels: designers, product managers, UX writers, developer advocates. Then compare that with your engineering headcount. If the ratio looks like one nervous violinist surrounded by a marching band, you’ve got your answer.
Our Engagement Triangle ranks human presence highest and written content lowest for building trust, which is why a monthly facilitated workshop plus YouTube beats five blog posts a week. Give the people who talk to developers a seat at the roadmap table.
Build both sides
Function and perception do one job together. Juicero poured everything into the first half and ended up with a beautifully built machine nobody believed in.
So the next time your DevTool building plan fills up with function, pause and ask what a developer will feel in their first session. Value isn’t purely objective. A lot of it lives in your users’ heads, and your competitors may be ignoring that. Go and be the one who doesn’t.
If you’d like a second pair of eyes on how your product comes across, we offer a free Blind Spot Call. Book one and tell us where you suspect the juice bag is being over-engineered.
Common Questions On DevTool Adoption
What is perceived value in developer tools, and how is it different from functional value?
Perceived value in developer tools is how good a product feels to use and how much developers believe it’s worth. Functional value is what the product actually does: the features, the speed and the reliability. Stateshift treats docs, onboarding and messaging as part of the product, because two tools can do exactly the same job and sit at very different prices in developers’ heads.
How do you measure perceived value in a developer product?
Measuring perceived value in a developer product starts with asking developers how specific interactions felt, such as the first run, and then checking the answers against behavior. Stateshift tracks two behavioral numbers: Interest to Intent, the share of first-time landing page visitors who click the primary call to action, and the share of visitors who reach a working result. Stateshift aims for at least 20% of website visitors reaching a working result.
What is a good landing page conversion rate for a developer tool?
Stateshift’s target for a developer tool landing page is 30 to 40% of first-time visitors clicking the primary call to action, a measure the Stateshift Model calls Interest to Intent conversion. In our experience, 10% means the page is broken, 15% is not enough and 25% shows real momentum. These are Stateshift’s working benchmarks, not industry-wide research. The first fix for a low rate is changing the headline and strapline, one element at a time.
What makes a developer product sticky over time?
A developer product stays sticky when developers get a fast, observable first win and a reason to come back. For developer tools, the first win is usually technical, such as an API call that returns useful data within about 10 minutes. Stateshift tracks seven-day return rate and time to first value, then watches 30-day retention to see whether the habit holds.
How do you build developer trust with product messaging?
Developers trust product messaging that is specific, names the trade-offs and talks about tasks and problems. Hype words like “accelerate” and “revolutionize” reduce engagement, while filler like “simply” and “just” erodes trust. The quick test is whether you’d say the line out loud to a developer’s face. If you wouldn’t, cut it.