
If you’re a founder or Head of DevRel at a technical B2B company, you’ve almost certainly had to defend a DevRel number in the last quarter. The question isn’t the hard part. The hard part is that most teams answer it with impressions, and impressions are exactly why those conversations fall apart.
Learning how to measure developer awareness properly is one of the most practical ways a DevRel team can earn credibility with leadership. At Stateshift, we built Influence Hours as the answer: reach multiplied by time multiplied by an engagement weight tied to how intimate the format is. A 30-minute in-person talk to 100 of your ideal customers isn’t the same unit of attention as 10,000 blog views. The math should say so.
TL;DR
- Developer awareness deserves a better metric than impressions.
- Influence Hours: Impressions × Time on channel × Engagement Weight, tracked weekly per channel, replaces follower counts and raw views with a single weighted-attention unit.
- It makes a conference talk, a YouTube video, and a LinkedIn post directly comparable on one axis.
- It plugs into conversion and revenue math in later phases.
- This post covers the definition, a worked example, how Influence Hours fit the Awareness stage of the Stateshift Model, and a phased rollout you can run in a something as simple as a Google Sheet.
Why are impressions a vanity metric in DevRel?
An impression is a served ad or a loaded page. That’s it. Not attention. Not interest. Not intent.
We’ve watched teams open a board meeting with “we drove 400,000 impressions last quarter” and lose the room by minute two, because the next question is always the same one: “so what happened next?” If the answer is another impression count on a different channel, the conversation is over.
There are three specific reasons impressions overstate what actually happened.
Not everything served is seen. Industry viewability sits well below 100%. Roughly a third of digital ads go unseen in some environments, per Integral Ad Science. A chunk of what your dashboard counts as an impression was loaded but never in front of a human eye.
A large slice of “traffic” isn’t human. Bots make up a majority of automated web traffic, and DevRel dashboards inherit that noise from the underlying analytics. Whatever number your tool shows for “impressions” this month, some of it is machinery talking to machinery.
The humans who are there don’t stay. This is the one that matters most for our work. Nielsen Norman Group’s research finds that readers absorb at most 28% of the words on a page, realistically closer to 20%. An impression counts the delivery of content. It doesn’t count the receipt of it.
Here’s the list we ask new clients to stop leading with: impressions, follower counts, subscriber counts, raw page hits, and unqualified “views.” Each one measures delivery, not attention. They belong in the appendix, not on the slide that opens the QBR.
What are Influence Hours?
Influence Hours is (Impressions × Time on channel) × Engagement Weight.
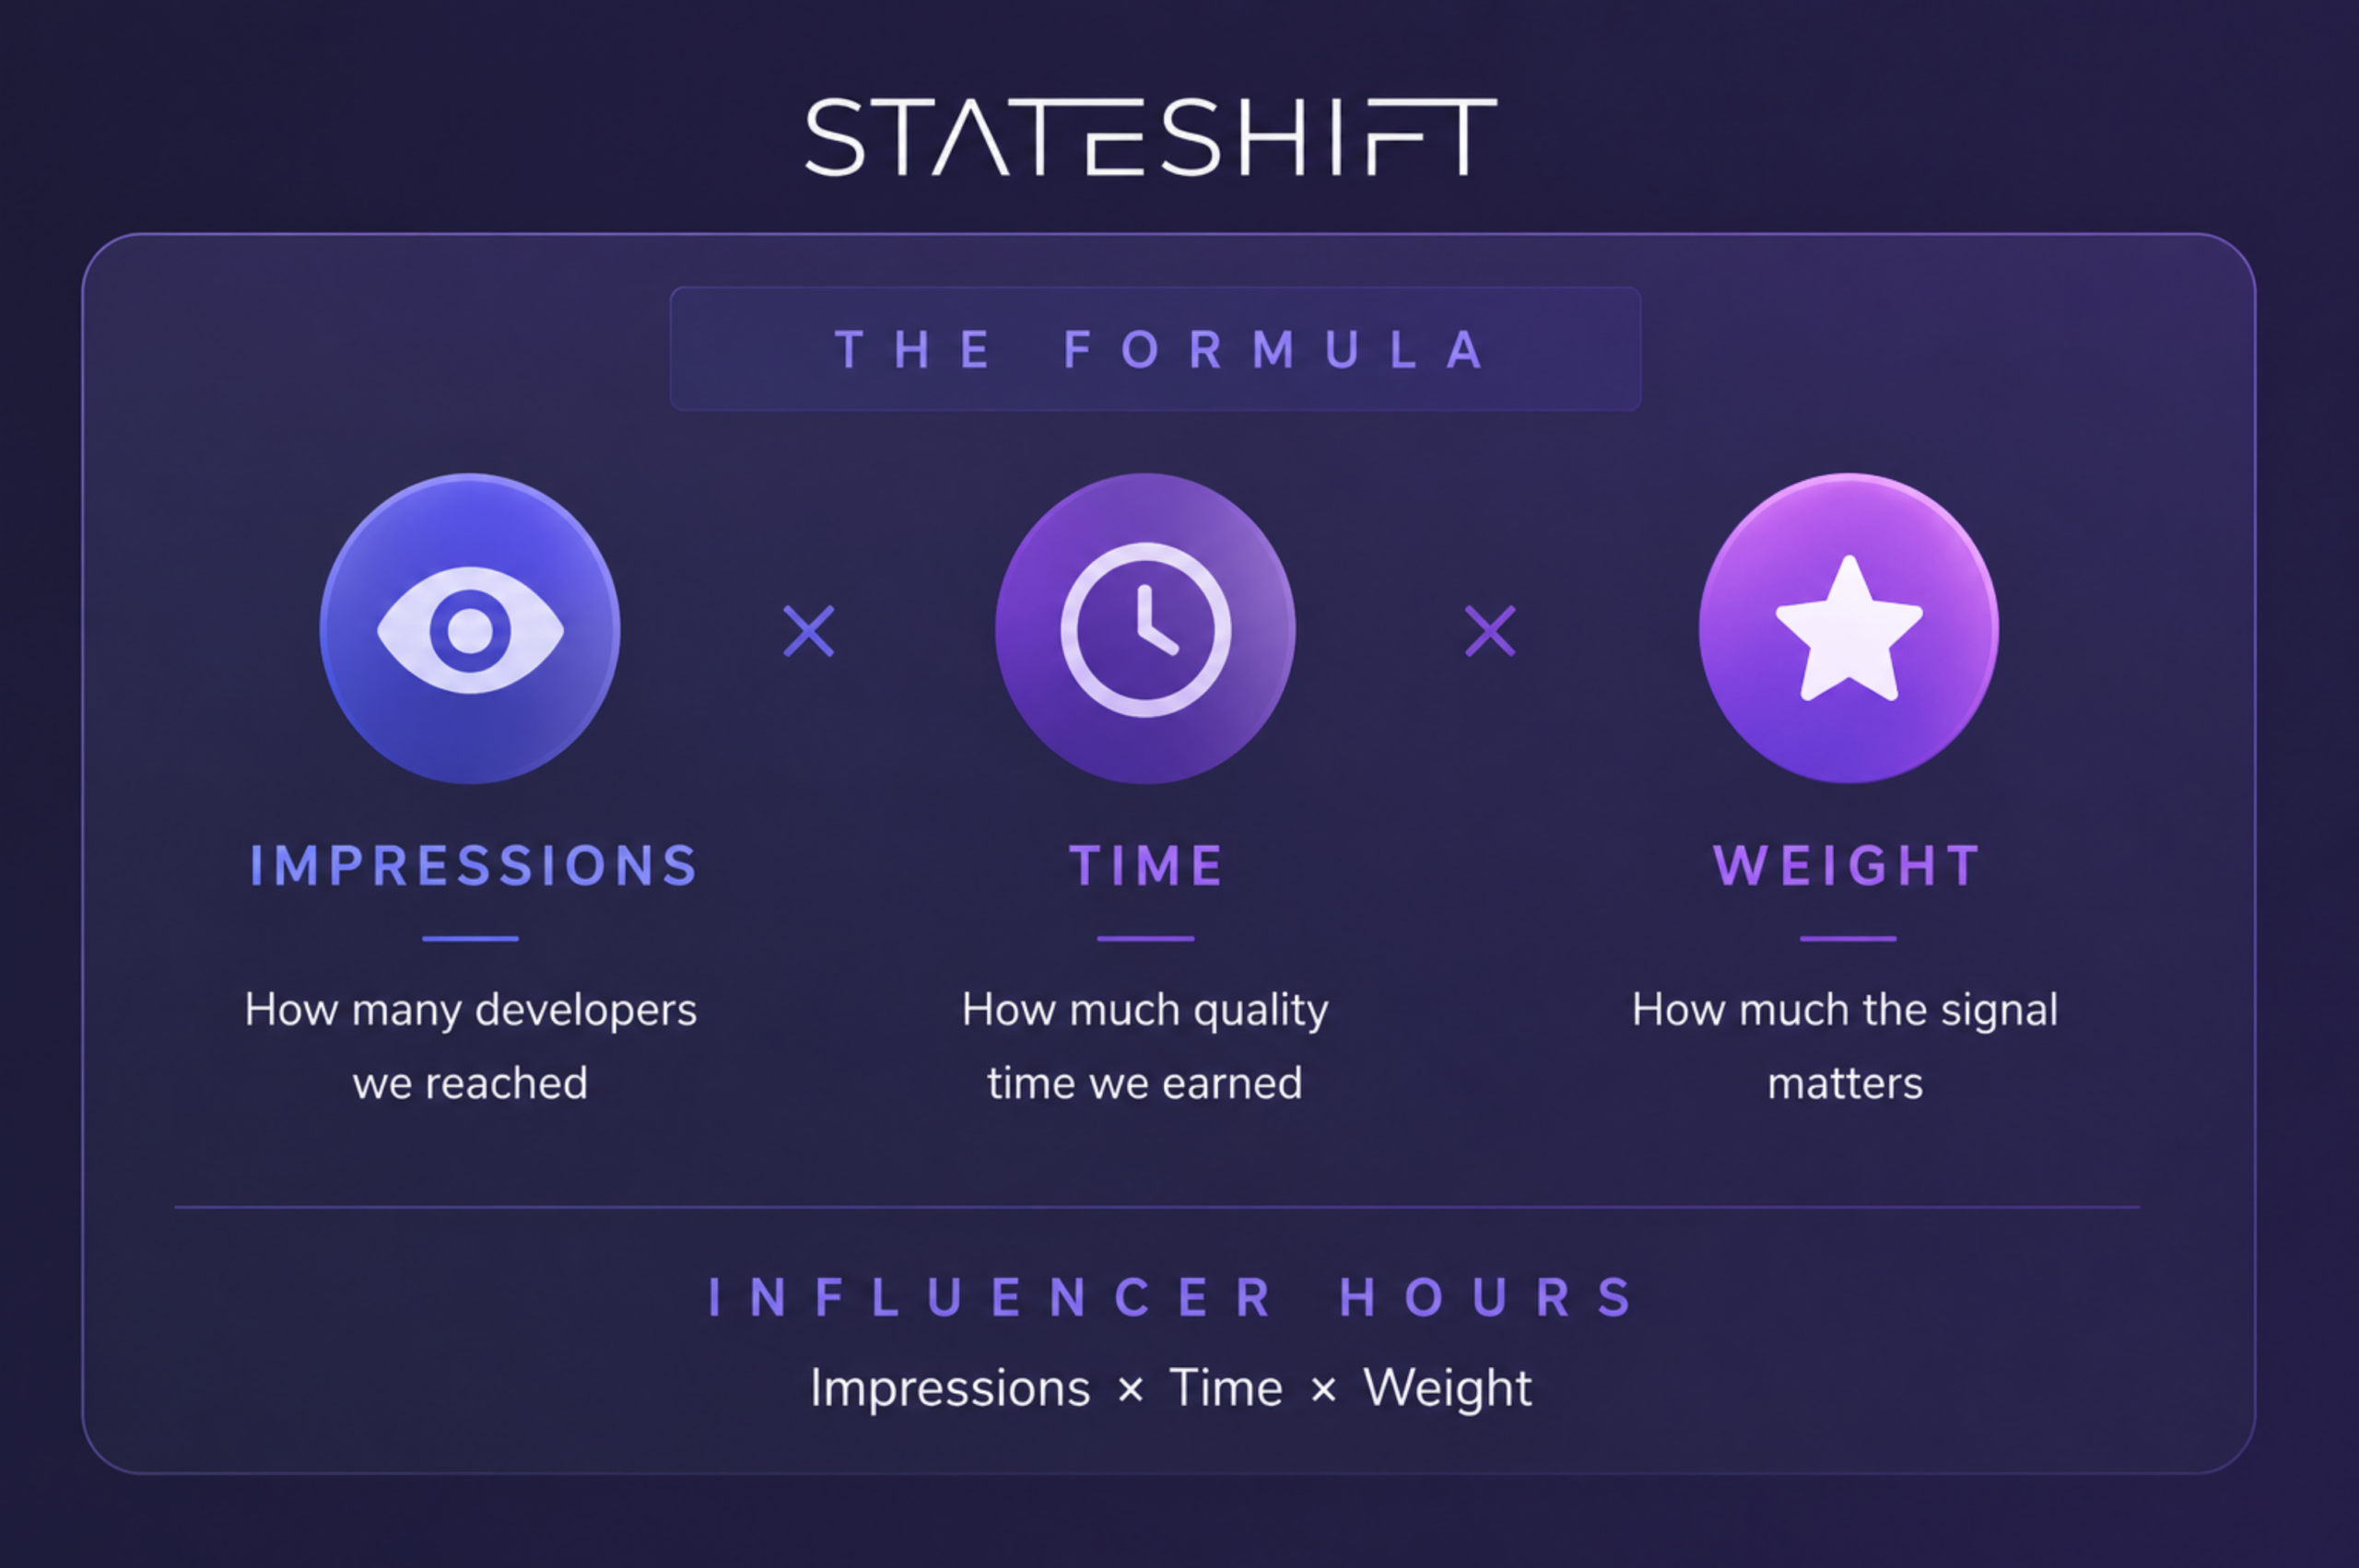
It’s that simple. Reach, multiplied by how long the reach lasted, multiplied by a weight that reflects how intimate the format is.
The phrase we keep coming back to at Stateshift is the one that matters most: not all attention is equal. A one-to-one hour with an ideal customer isn’t the same as an hour of scroll time on LinkedIn. The formula makes that difference explicit so leadership sees one graph instead of a dashboard of activity metrics that don’t compare to each other.
There are three pieces to Influence Hours. Get them in your head and the rest of the metric follows.
Reach is the count of humans who could have paid attention. Attendees in the room, views on the video, listens on the podcast, impressions on the post. Whatever your platform gives you, that’s the starting number.
Time on channel is how long those humans actually spent with the format. Talk duration for a live audience. Average watch time for video. Average listen-through for podcasts. Average time on page for a blog post. Split social time between engaged users (a minute or two) and scrollers (about five seconds), because averaging them across a bimodal distribution produces a number that isn’t true for anyone.
Engagement weight is where intimacy enters the math. A one-to-one in-person conversation gets the top weight. A scrolled-past LinkedIn post gets the bottom weight. Everything in between sits on a scale from most intimate to least. We don’t publish the exact multipliers we use, because they get calibrated to each business we work with. What matters is that in-person, small-group, and long-form audio always sit above short-form video, written content, and feed-based social. If your weights ever produce a different order, you’ve made an error somewhere in the numbers.
The weight is the part most teams get wrong the first time they try this. The instinct is to make everything equal, or to bump the weight on whatever channel the CEO is proud of. Both destroy the metric. The whole point of the weight is that it holds an opinion about what a human actually gave you, and that opinion has to be applied consistently across every channel.
How do you measure the ROI of a conference talk vs a blog post?
Quick note on the numbers you’re about to see. The weights in these examples are illustrative. They’re the shape of the math, not our actual calibration. We don’t publish the weights we use with clients, and you shouldn’t lift anyone else’s either. What “intimacy” looks like on your channels depends on your buyer, your format mix, and what your team is actually doing well right now. Use the numbers below to see how the formula behaves. Calibrate your own in Phase 1.
Let’s start with an in-person talk. It’s the simplest calculation and it produces a number that surprises people every time.
You deliver a 30-minute talk at a conference. 100 people are in the room. Assign a large-in-person weight of 0.8.
100 attendees × 30 minutes × 0.8 = 40 Influence Hours.
Now compare a blog post. 500 hits at 2.5 minutes average time on page, at a written-content weight of 0.2.
500 hits × 2.5 minutes × 0.2 ≈ 4 Influence Hours.
Ten times the audience of the room, one tenth the influence. Once conversion data is attached in Phase 2, the conversion rate per Influence Hour on the talk is typically several multiples higher again, because the intimacy is doing the work the weight already reflects.
The YouTube comparison lands the same way. The same team pushes a video the following week. It lands 1,000 views. Average watch time is 3.2 minutes. Apply a YouTube weight of 0.35.
1,000 views × 3.2 minutes × 0.35 ≈ 19 Influence Hours.
Ten times the audience of the in-person talk. Less than half the influence.
This is what we mean when we say impressions lie. If you were reporting on views alone, the YouTube video looks like the win of the quarter and the talk looks like a rounding error. Weight the two by format and time, and the story reverses. That’s the whole point of the metric.
Social sits in the same family, once you scale it up to make the comparison fair. A LinkedIn post that reaches 10,000 impressions at an 8% engagement rate, 800 engaged users at about 75 seconds, 9,200 scrollers at about 5 seconds, times a low social weight of 0.12, works out to roughly 3.5 Influence Hours. Ten times the reach of the conference talk, less than a tenth the influence. Which, if you’ve watched a room of 100 buyers lean in for half an hour, is the ranking that matches reality.
Where Influence Hours fits in our work with clients
Influence Hours is the measurement layer for the Awareness stage of the Stateshift Model, the stage where a developer or buyer first encounters your company and begins to form an opinion. Awareness is the hardest stage to measure honestly because most of what happens there doesn’t convert immediately. Someone reads a post, watches a talk, listens to a podcast episode, follows an ambassador on GitHub. Nothing shows up in your funnel that week. Something shifts anyway.
We treat awareness as the output of five systems working together: content, community, ambassadors, events, and product-led motion. We call this the 5-System Framework, and it’s the reason a single weighted-attention unit matters so much. Each system produces reach in a different shape. Content gives you long-tail written attention. Community gives you recurring, low-intensity engagement. Ambassadors give you high-intimacy talks and workshops that are almost impossible to compare to a blog post unless you weight them. Events give you a burst of dense, in-room time. Product-led motion gives you signal from people already inside the funnel. Without Influence Hours, you’re comparing YouTube views to Discord joins to conference badge scans and pretending the numbers mean the same thing. With Influence Hours, they’re all on the same axis.
This matters most for teams early in their DevRel build, where every hour of the team’s time has to prove itself. If you’re standing up a function at Series A with two or three people, you can’t afford to spend a quarter chasing impressions that don’t convert, which is exactly why Influence Hours is the first metric we recommend Series A DevRel teams start with. It forces the sequencing conversation early: what’s actually earning weighted attention, and what’s just producing activity.
Phased rollout: Awareness, Conversion, Revenue
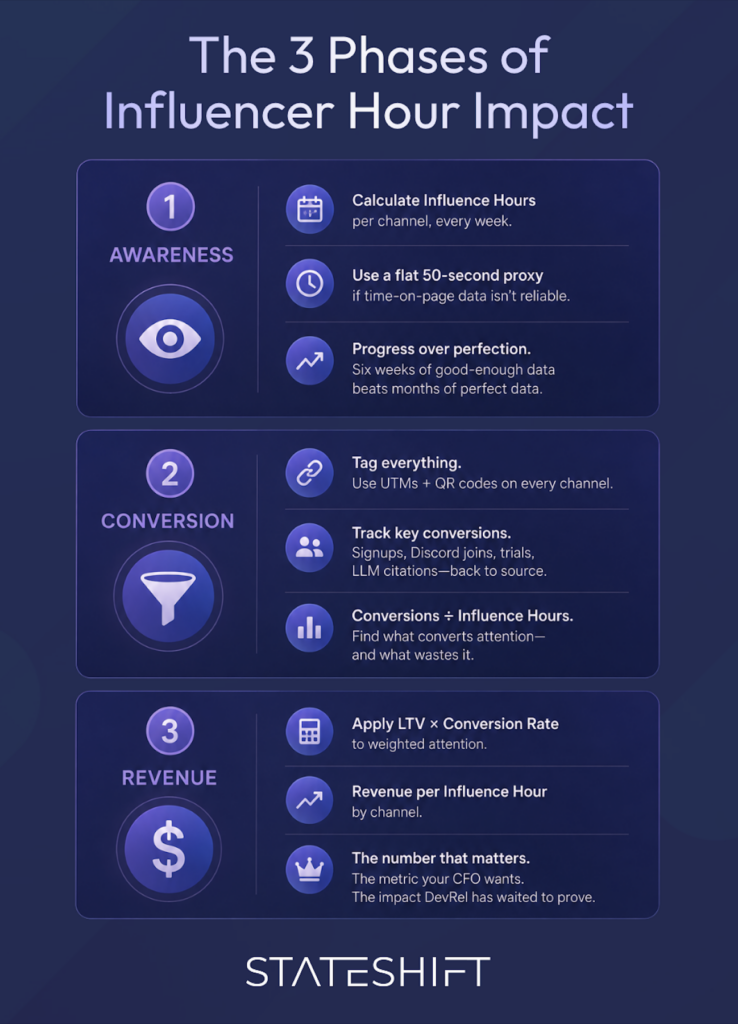
The mistake most teams make is trying to run all three phases in the first month. Don’t. Get Phase 1 stable first. The math is only useful if the underlying data is honest.
Phase 1: Awareness. Calculate Influence Hours per channel, every week, not monthly. The momentum-tracking value of the metric collapses at monthly cadence. A bad week hides inside a good month, and the whole point is to see the shape of the curve as you make changes. If your server logs for time-on-page aren’t reliable yet, use a flat 50-second proxy while you fix the instrumentation. We’d rather see six weeks of consistent-but-approximate weekly data than three months of perfect data that arrives too late to act on.
Phase 2: Conversion. Before you touch a UTM, do the step most teams skip: define one to three convertible outcomes per channel. Not KPIs, specific, countable actions that map to a business objective. Lead generation maps to free account signups. Community work maps to Discord or Slack joins. Brand awareness maps to LLM citation pickups tracked in a tool like Peec. Product work maps to trial activations.
Why does this order matter? If you instrument before you’ve agreed on what counts, you end up with a dashboard full of events that nobody trusts. Get the outcomes defined first, then attach UTMs and QR codes to every channel so you can trace each outcome back to its source.
Once that’s in place, the calculation is straightforward: divide conversions by Influence Hours for that channel. That ratio tells you which formats are converting the weighted attention they earn, and which are generating hours without moving anyone forward. The conversion path matters too. A blog post that drives 20 Influence Hours and produces two free trial signups is outperforming a large webinar that drives 50 Influence Hours and produces one. The denominator, weighted attention, not raw traffic, is what makes the comparison honest.
In our experience working with DevRel teams, this is the phase where ambassador-led work starts to look extraordinary and mass-social usually starts to look expensive.
Phase 3: Revenue. Take the conversions-per-Influence-Hour rate from Phase 2, apply your customer LTV and conversion rate, and you get revenue per Influence Hour by channel. That’s the number your CFO wants, and the number the DevRel field has been trying to produce for a decade.
The math isn’t complicated. If a channel produces 40 Influence Hours, converts at 5%, and your average LTV is $10,000, that channel generated $20,000 of attributed revenue. Run it across every channel and you have a single table your leadership team can use to decide where to invest next quarter.
At Stateshift, we structure that table the same way every time: channel, Influence Hours, conversion rate, LTV, and attributed revenue. Week-over-week Influence Hours show momentum. Cumulative totals give leadership the long view. The top three performing channels by conversion rate sit at the top of the dashboard so the next investment decision is visible before anyone asks for it.
The 2024 State of DevRel report shows revenue influenced in the top three Program Success metrics for the first time, with 17.5% of teams now tracking it. Influence Hours is what makes that math tractable at the channel level, because without the weighted attention denominator from Phase 1, Phase 3 is just guesswork dressed up as a spreadsheet.
Run the whole thing in a Google Sheet for the first six weeks or so. Don’t build a dashboard yet. Don’t automate. The manual reps are how you find out which weights need calibrating for your business, which channels are missing time data, and which conversion events are the ones leadership actually cares about. When we’ve helped teams skip the manual phase, the automated version has always needed to be rebuilt.
Common failures with Influence Hours
We’ve seen the same handful of mistakes across every rollout.
Treating all hours as equal. Drop the weights and you’ve reinvented “time on page times sessions,” which tells the same misleading story impressions do. The check is simple: if your ranking of channels by Influence Hours looks identical to your ranking by raw reach, the weights aren’t doing anything.
Ego super-weights. We do let teams reserve room above the top weight for exceptional cases, like a keynote at a target customer’s conference. Use it more than a handful of times a quarter and you’re not measuring, you’re marketing internally.
Ignoring social time splits. Apply one blended time to a bimodal distribution and social will either dominate the sheet or vanish from it. Neither is accurate. Blend them into one average and social either dominates the sheet on fake attention or vanishes from it entirely. Split the audience using your platform’s engagement rate, apply the two times separately, and sum.
Skipping the weekly cadence. Monthly reporting kills the momentum signal. The reason to run this weekly is that you can see a change in trajectory two weeks after you make a decision, not two months after. Weekly also forces the instrumentation conversation early… if you can’t pull time-on-page or watch time by Friday, you find out in week one instead of week eight.
Reporting Google Search Console as your channel view. GSC only sees Google organic search. It misses social, newsletter, direct traffic, and, increasingly, LLM referrals from ChatGPT, Perplexity, Claude, and Gemini. That last slice isn’t a rounding error anymore. If GSC is your source of truth, you’ll under-count the channels that are increasingly doing the work, and defund them right when they start to matter. Add an “LLM referral” line to the sheet now, even if the numbers start small. You want the line to exist before you need to explain its slope.
Your next steps
If your team is being asked to defend DevRel spend right now and impressions are the number on the slide, replace the slide.
Open a Google Sheet. List your channels. Pull reach and time data for each of the last six weeks. Assign an engagement weight to each channel, starting rough and calibrating as you go. Multiply the three together. Plot a single line for total Influence Hours per week and one line per channel. That’s Phase 1. It will take an afternoon, and it will change the conversation you have with your leadership team next Monday.
If you want a second set of eyes on the setup, or on where Influence Hours fits into a broader DevRel strategy and how it connects to community, ambassador programs, and product-led motion, book a Blind Spot Call with Stateshift.
Common questions on how to measure developer awareness
How do you measure developer awareness beyond impressions?
With Stateshift’s Influence Hours: Impressions × Time on channel × Engagement Weight, tracked weekly per channel. It’s comparable across formats and ready to plug into conversion and revenue math when Phase 2 and Phase 3 come online. Influence Hours replaces impressions as the Awareness-stage unit inside the Stateshift Model.
What metrics should a developer GTM team track?
At the Awareness stage, Influence Hours per channel. At Conversion, conversions per Influence Hour. At Revenue, revenue per Influence Hour, using LTV times conversion rate. Below that, keep qualitative signals about who is engaging as a supporting layer. Influence Hours won’t tell you that on its own.
What are vanity metrics in DevRel and what should replace them?
Impressions, follower counts, subscriber counts, unqualified “views,” and raw page hits. Replace them with a weighted attention metric tied to conversion and revenue. Stateshift’s answer is Influence Hours: reach times time times an engagement weight, tracked weekly per channel.
How do you measure the ROI of a conference talk vs a blog post?
Run both through Influence Hours. A 30-minute talk to 100 people at a large-in-person weight works out to about 40 Influence Hours. A blog post with 500 hits at 2.5 minutes average time and a written-content weight works out to about 4. Then attach conversion data. In our experience, the conversion rate per Influence Hour on the talk is typically several multiples higher, because the intimacy is doing the work the weight already reflects.
What DevRel metrics actually matter to leadership?
The three that map to the stages leadership already understands: Influence Hours (awareness), conversions per Influence Hour (conversion), and revenue per Influence Hour (revenue). Everything else is a supporting signal. This is the stack we use at Stateshift so a Head of DevRel can walk into a board meeting with one graph per stage instead of a dashboard nobody trusts.